Background
I'm working on a reimplementation of Sixten, a dependently typed programming language that supports unboxed data. The reimplementation currently lives in a separate repository, and is called Sixty, though the intention is that it going to replace Sixten eventually. The main reason for doing a reimplementation is to try out some implementation techniques to make the type checker faster, inspired by András Kovács' smalltt.
In this post I'm going to show some optimisations that I implemented recently. I will also show the workflow and profiling tools that I use to find what to optimise in Haskell programs such as Sixty.
A benchmark
What set me off was that I was curious to see how Sixty would handle programs with many modules. The problem was that no one had ever written any large programs in the language so far.
As a substitute, I added a command to generate nonsense programs of a given size. The programs that I used for the benchmarks in this post consist of just over 10 000 lines divided into 100 modules that all look like this:
module Module60 exposing (..)

import Module9
import Module24
import Module35
import Module16
import Module46
import Module37
import Module50
import Module47
import Module46
import Module3

f1 : Type
f1 = Module46.f10 -> Module46.f20

f2 : Type
f2 = Module50.f24 -> Module47.f13

[...]

f30 : Type
f30 = Module37.f4 -> Module24.f24
Each module is about 100 lines of code, of which a third or so are newlines, and has thirty definitions that refer to definitions from other modules. The definitions are simple enough to be type checked very quickly, so the benchmark makes us focus mostly on other parts of the compiler.
I'd also like to write about the type checker itself, but will save that for other posts.
Profiling
I use three main tools to try to identify bottlenecks and other things to improve:
bench is a replacement for the Unix
timecommand that I use to get more reliable timings, especially useful for comparing the before and after time of some change.GHC's built-in profiling support, which gives us a detailed breakdown of where time is spent when running the program.
When using Stack, we can build with profiling by issuing:
Then we can run the program with profiling enabled:
This produces a file
sixty.profthat contains the profiling information.I also really like to use ghc-prof-flamegraph to turn the profiling output into a flamegraph:
Threadscope is a visual tool for debugging the parallelism in a Haskell program. It also shows when the garbage collector runs, so can be used when tuning garbage collector parameters.
Baseline and initial profiling
We start out on this commit.
Running sixty check on the 100 module project on my machine gives us our baseline:
| Time | |
|---|---|
| Baseline | 1.30 s |
The flamegraph of the profiling output looks like this:

Two things stick out to me in the flamegraph:
- Parsing takes about 45 % of the time.
- Operations on
Data.Dependent.Maptake about 15 % of the time, and a large part of that is calls toQuery.gcomparewhen the map is doing key comparisons during lookups and insertions.
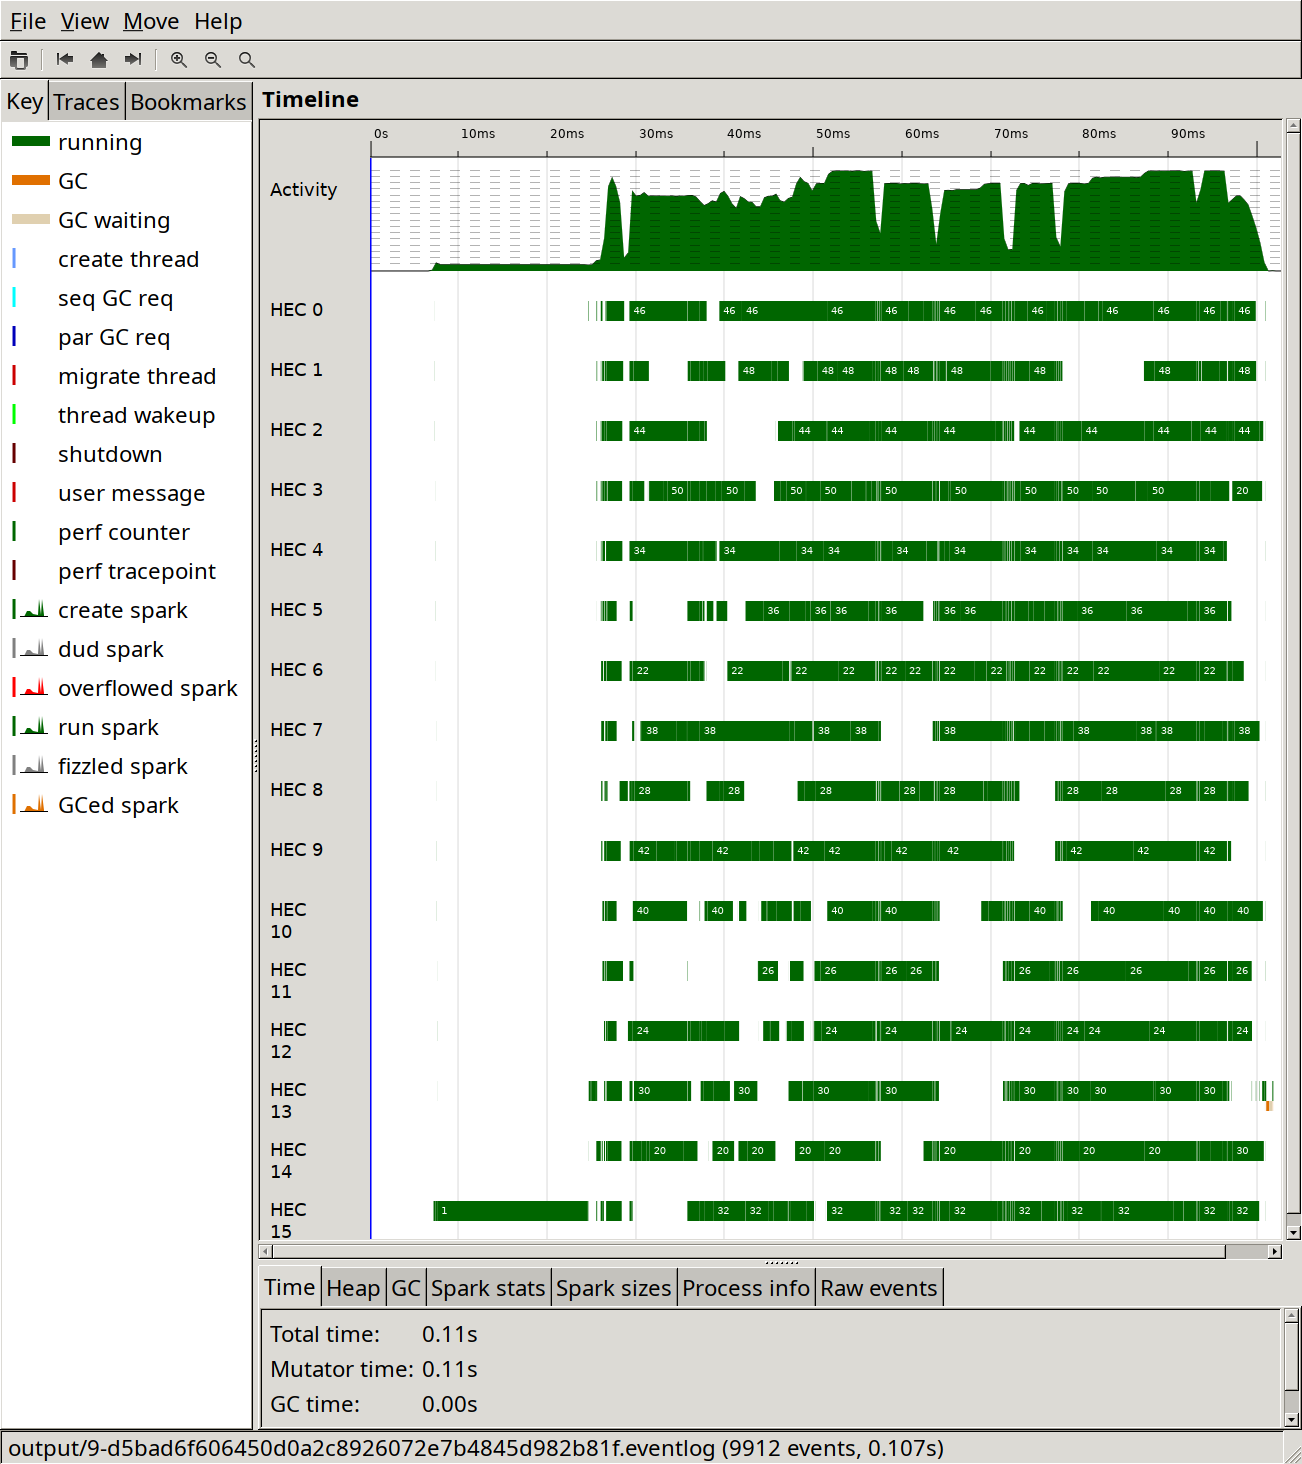
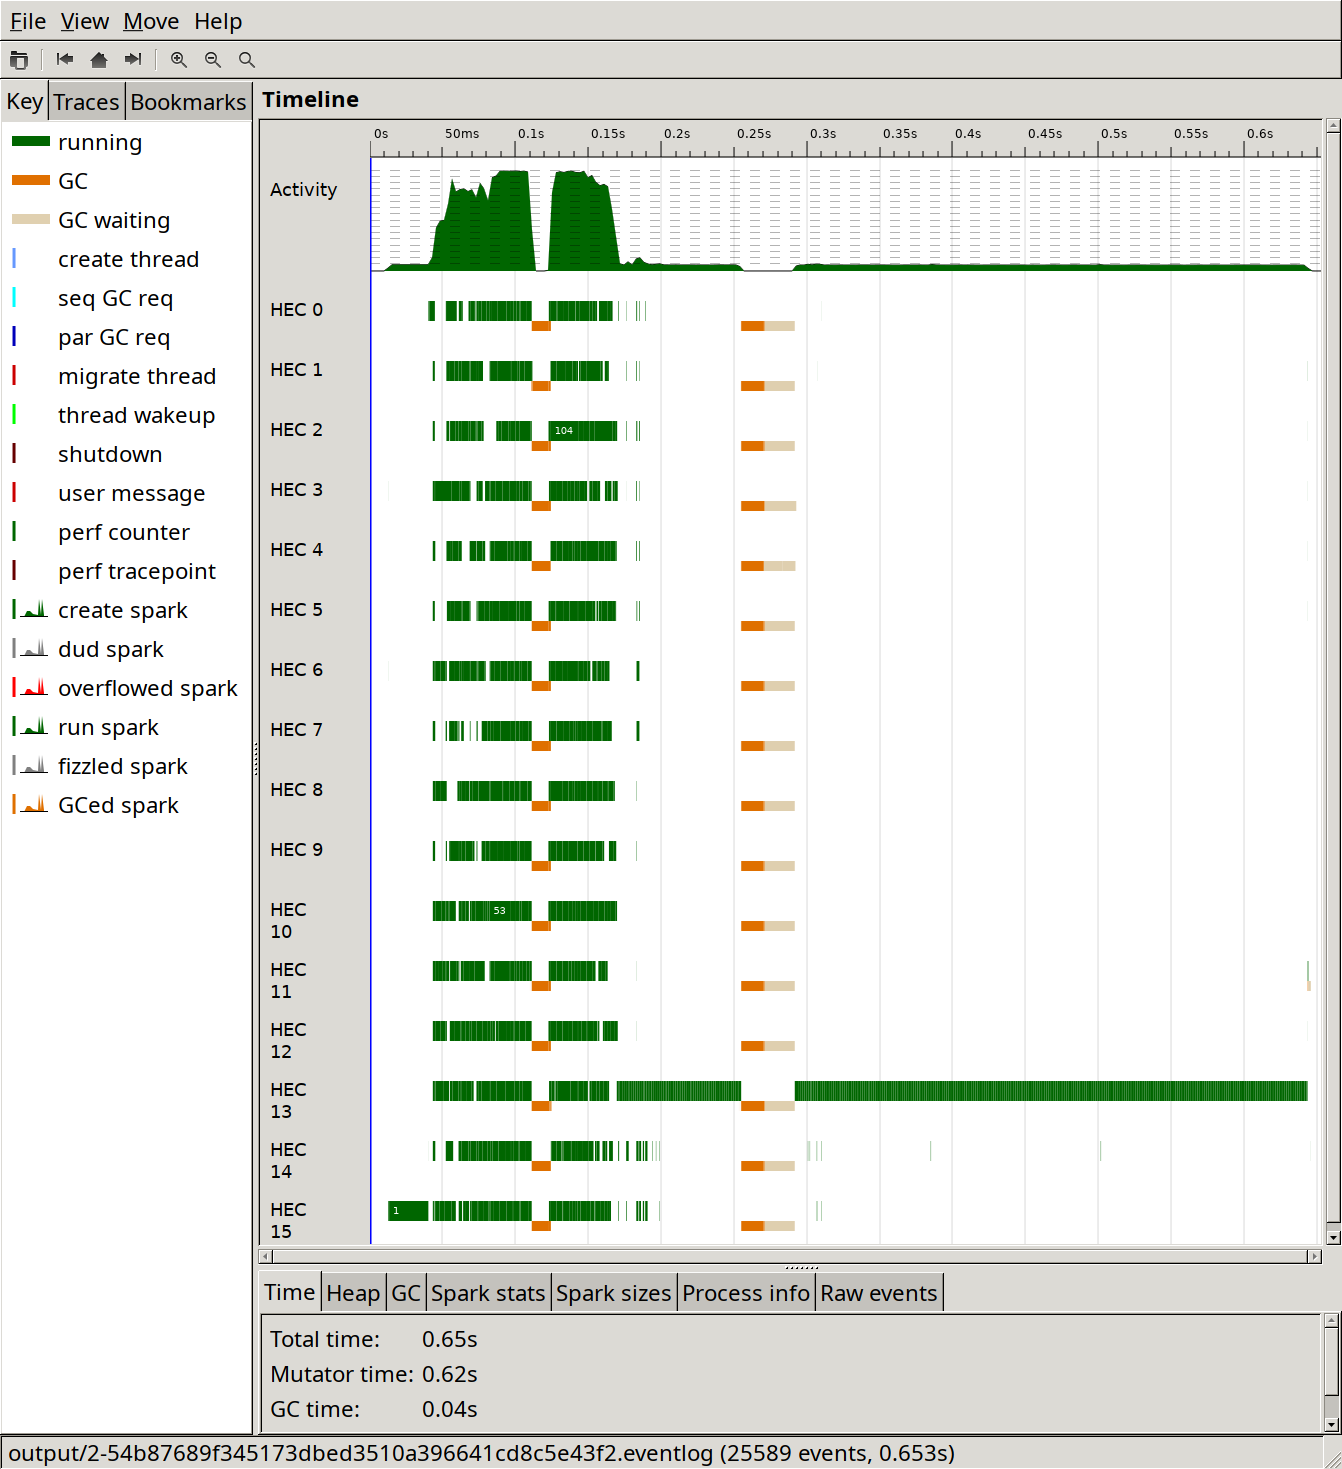
Here's what a run looks like in ThreadScope:
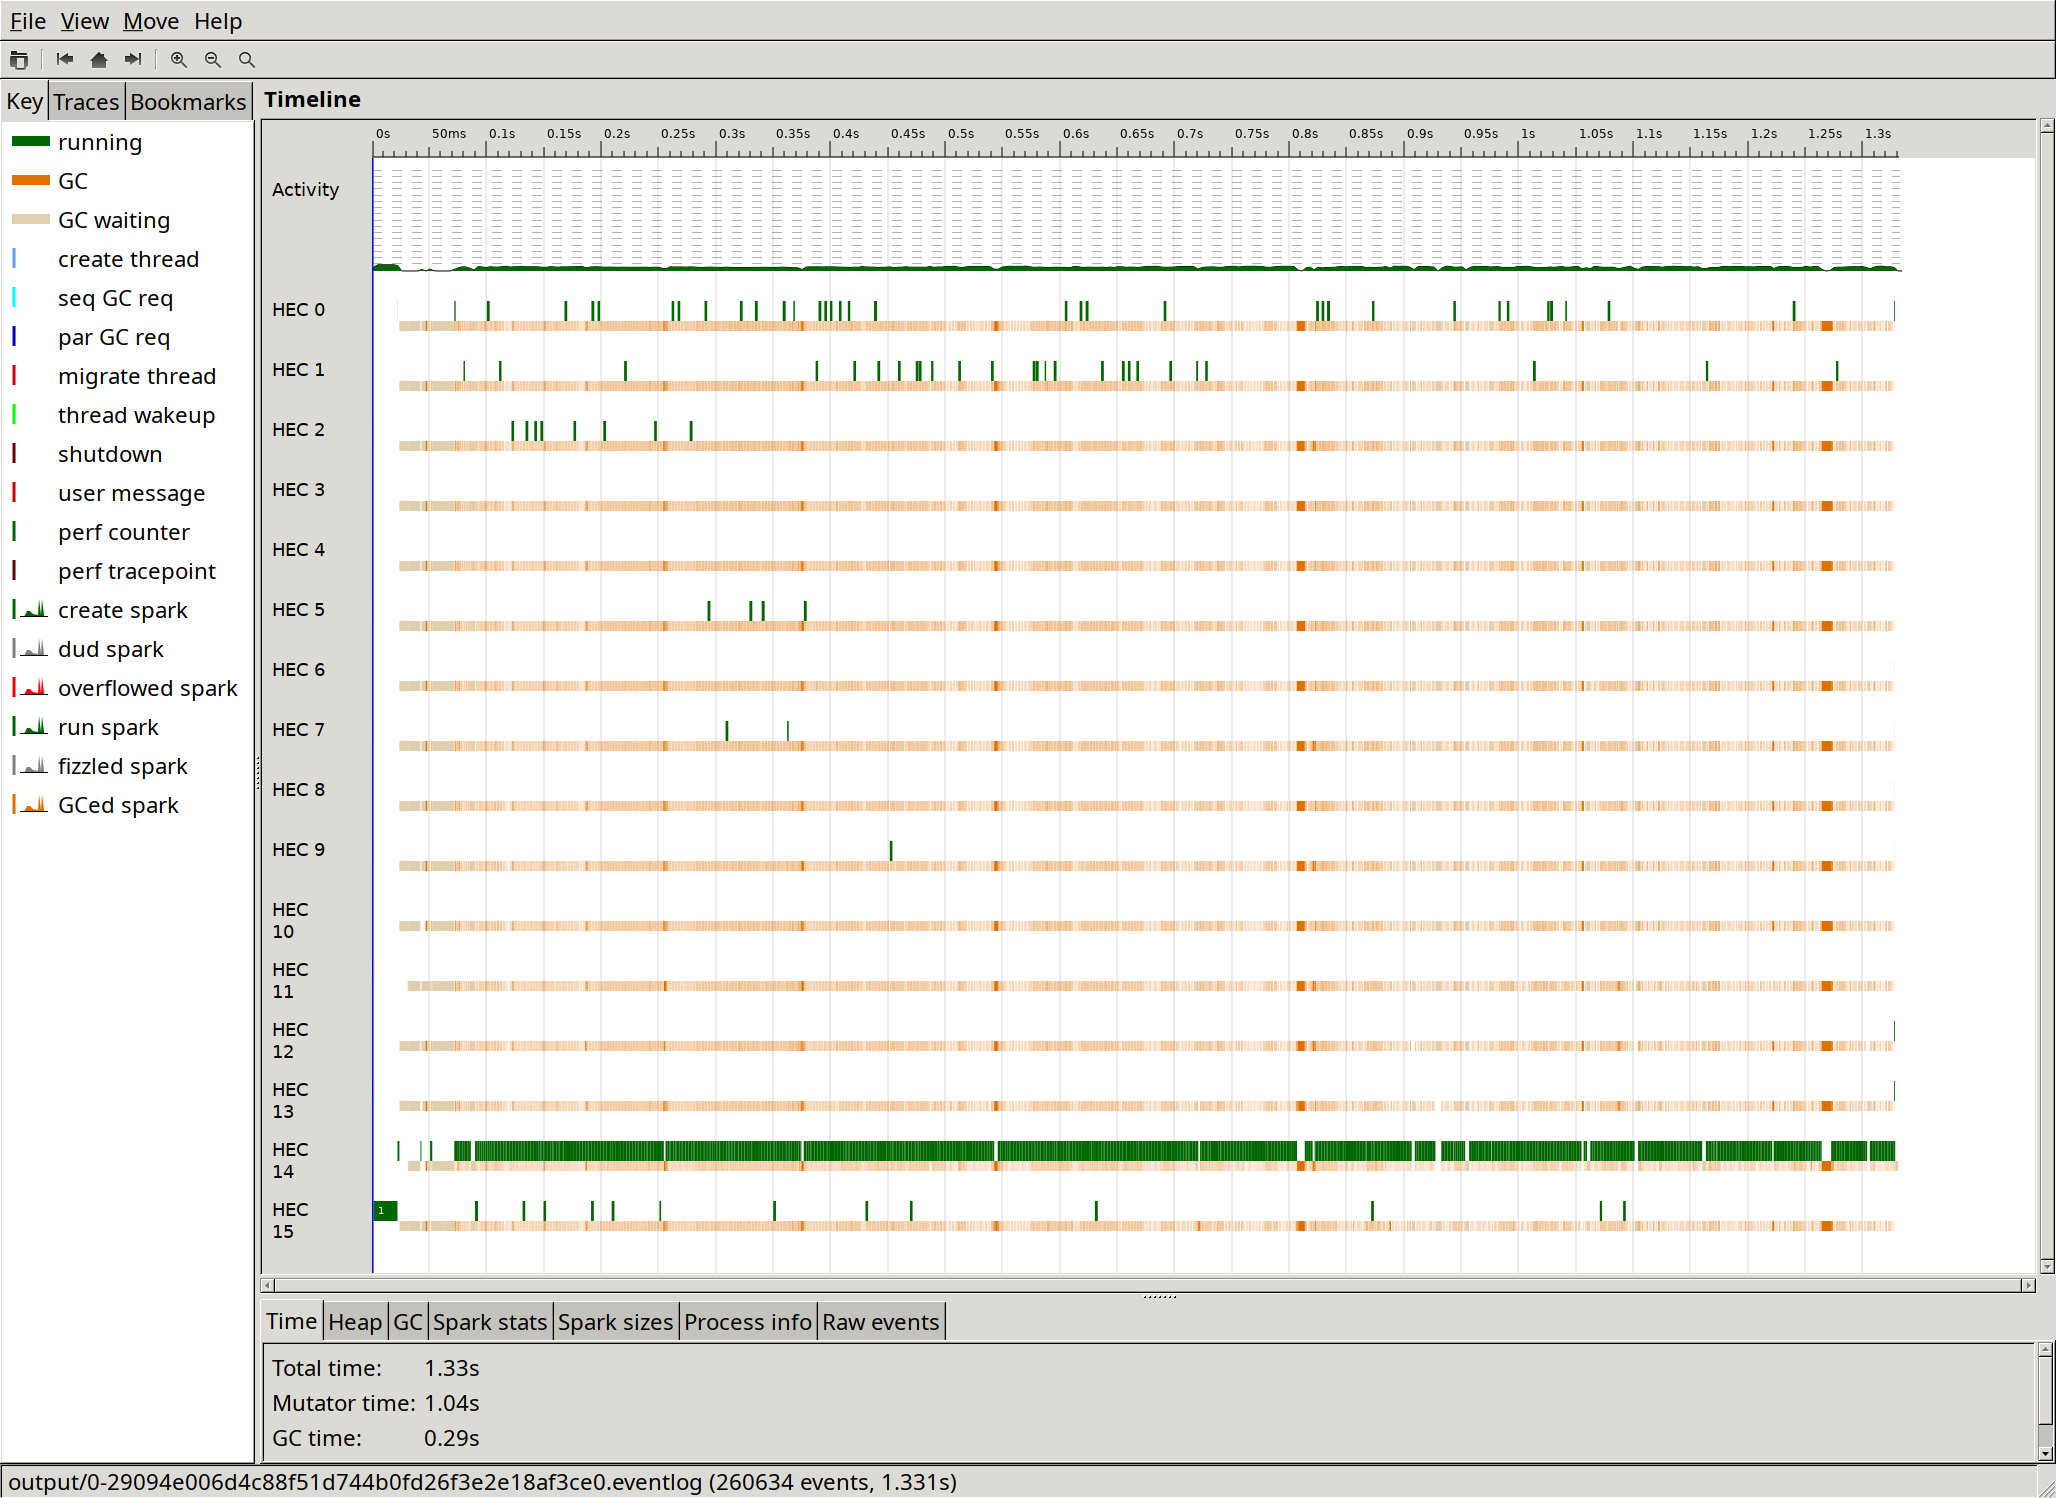
And here's a more zoomed in ThreadScope picture:
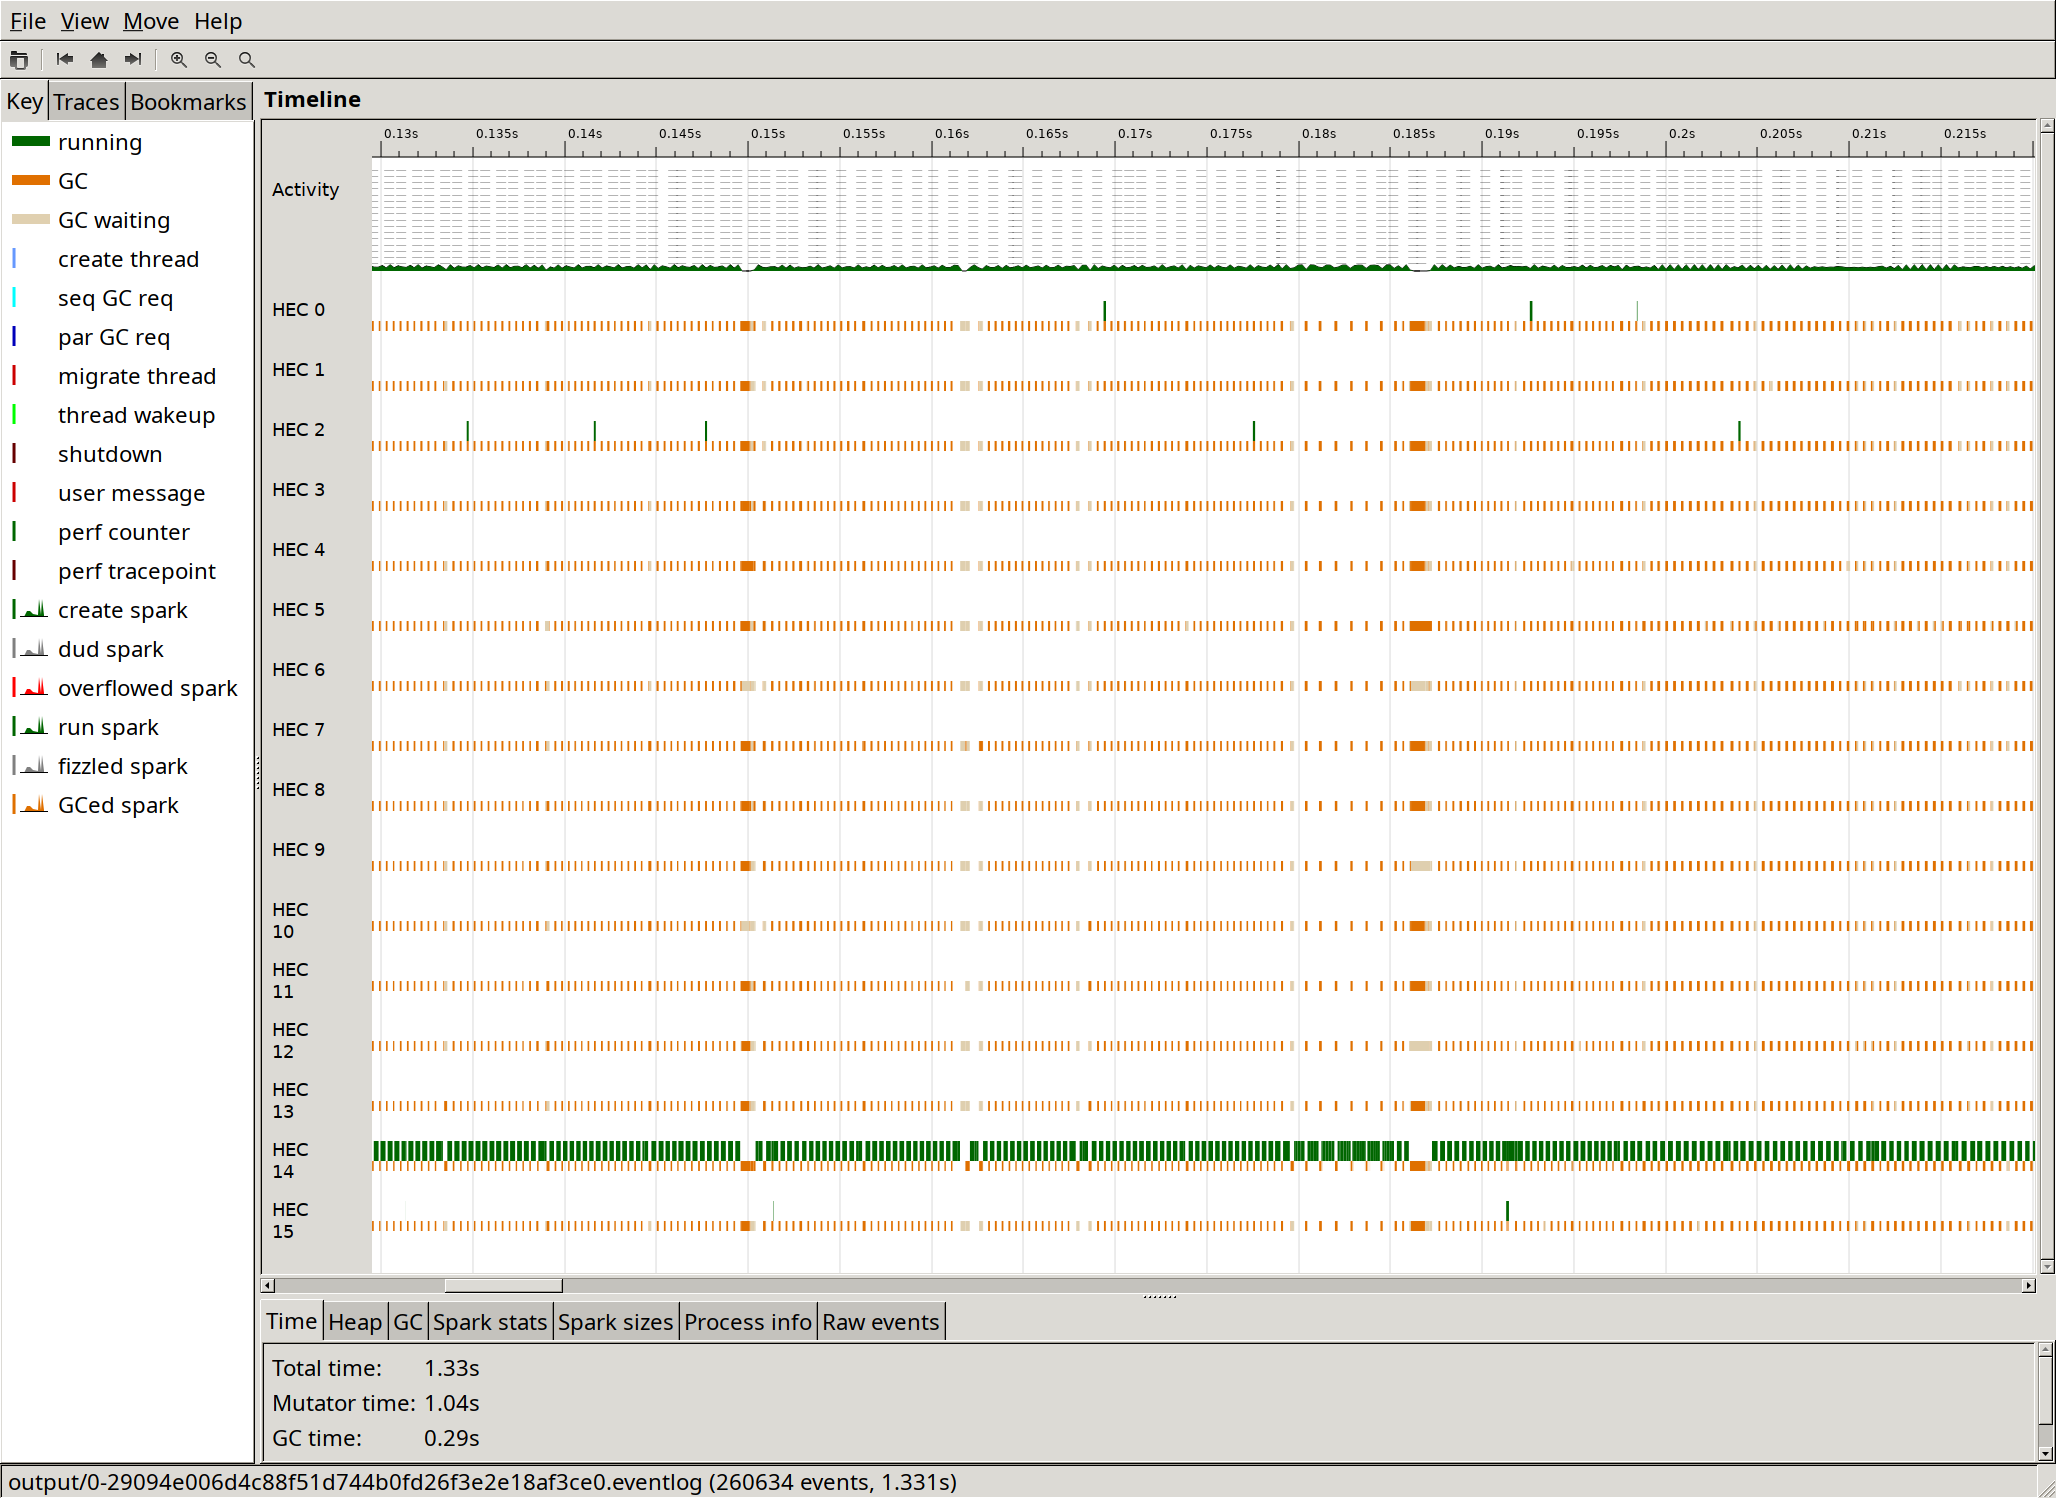
I note the following in the ThreadScope output:
- One core is doing almost all of the work, with other cores only occasionally performing very short tasks.
- Garbage collection runs extremely often and takes just over 20 % of the time.
Optimisation 1: Better RTS flags
As we saw in the ThreadScope output, garbage collection runs often and takes a large part of the total runtime of the type checker.
In this commit I most notably introduce the RTS option -A50m, which sets the default allocation area size used by the garbage collector to 50 MB, instead of the default 1 MB, which means that GC can run less often, potentially at the cost of worse cache behaviour and memory use. The value 50m was found to be the sweet spot for performance on my machine by trying some different values.
The result of this change is this:
| Time | Delta | |
|---|---|---|
| Baseline | 1.30 s | |
| RTS flags | 1.08 s | -17 % |
The ThreadScope output shows that the change has a very noticeable effect of decreasing the number of garbage collections:
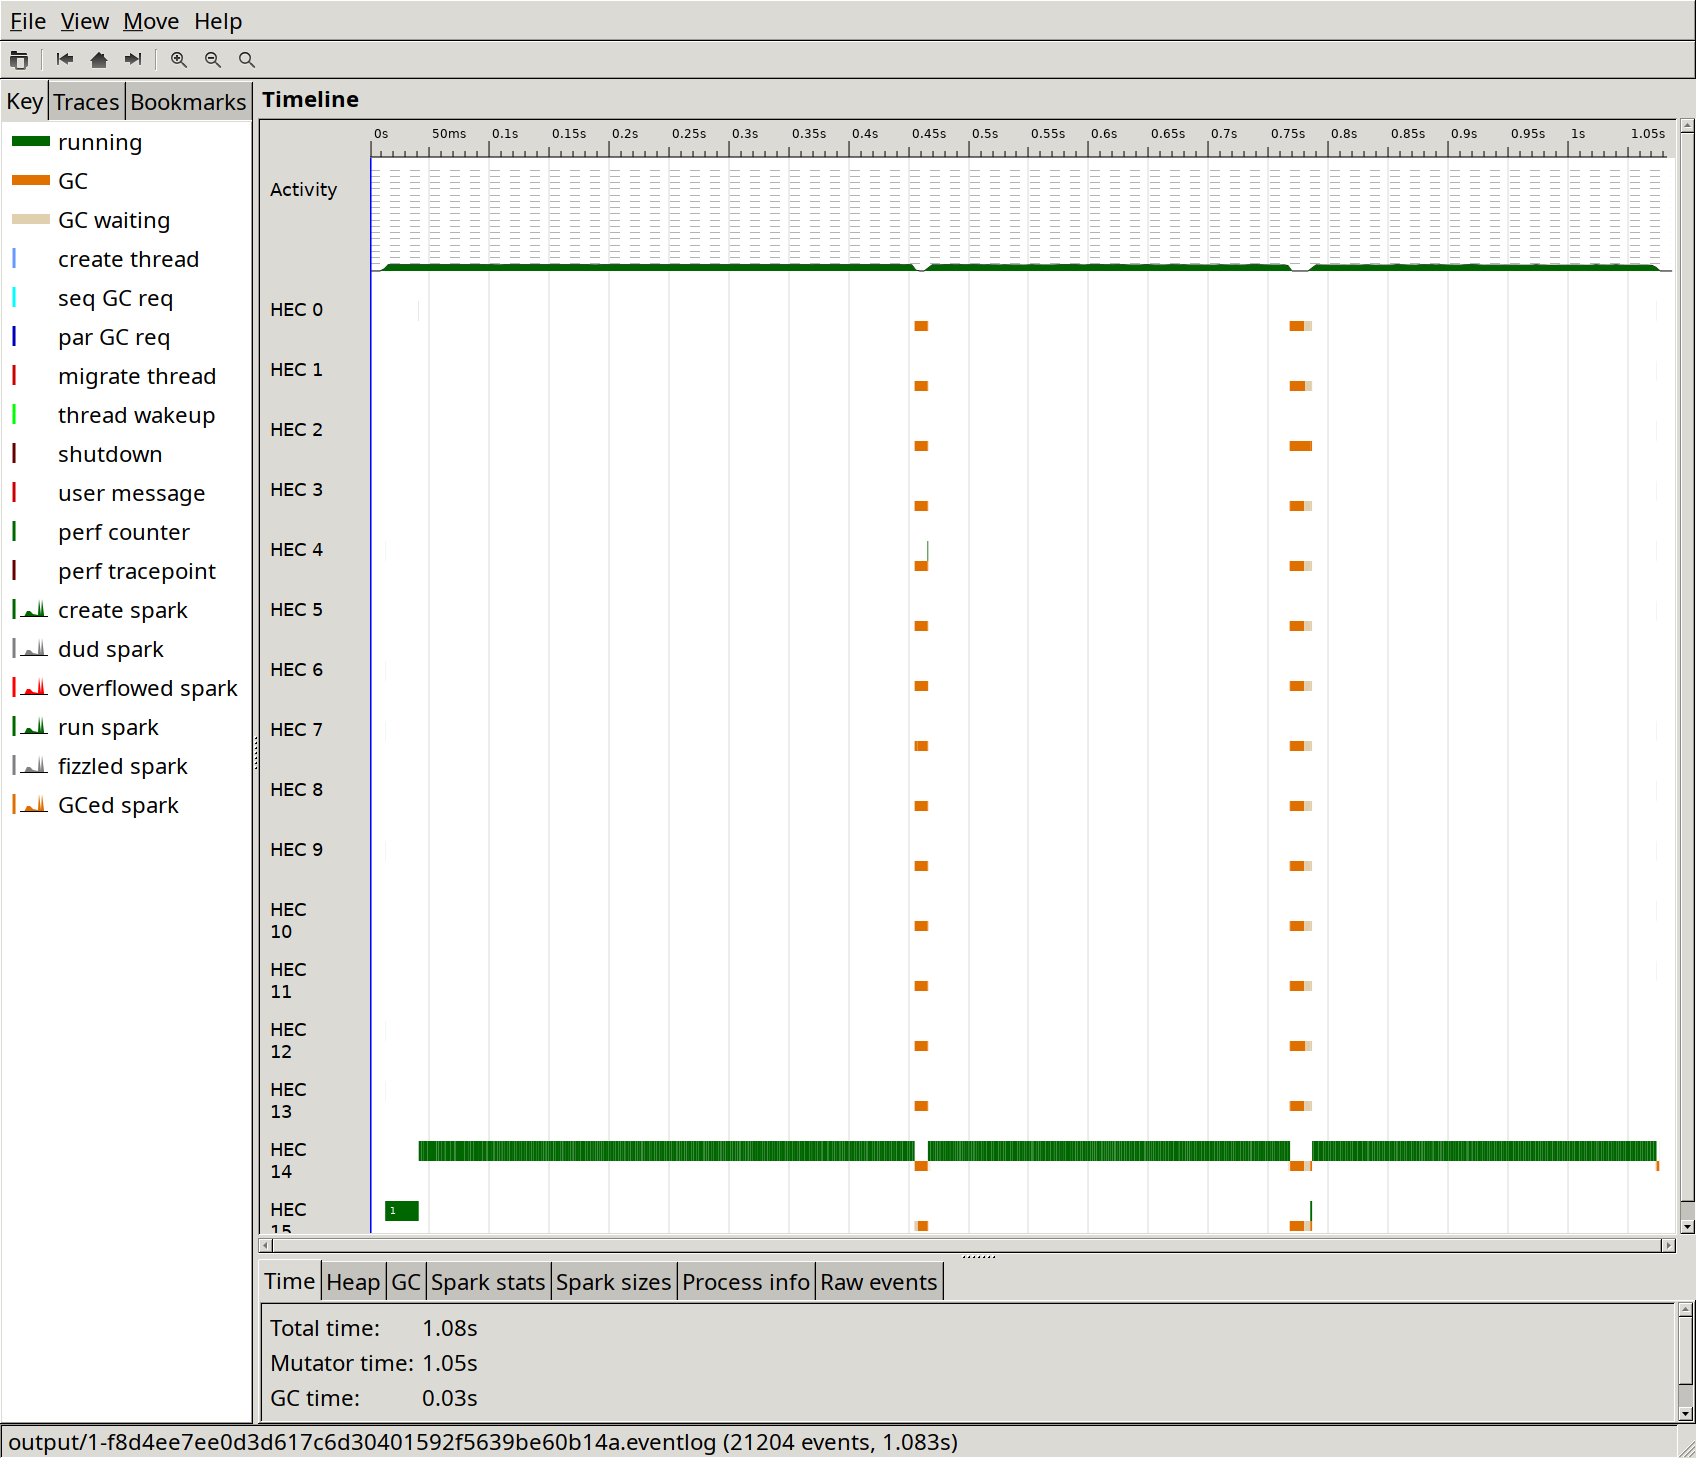
Also note that the proportion of time used by the GC went from 20 % to 3 %, which seems good to me.
Optimisation 2: A couple of Rock library improvements
Rock is a library that's used to implement query-based compilation in Sixty. I made two improvements to it that made Sixty almost twice as fast at the task:
| Time | Delta | |
|---|---|---|
| Baseline | 1.30 s | |
| RTS flags | 1.08 s | -17 % |
| Rock | 0.613 s | -43 % |
The changes are:
- Using
IORefs and atomic operations instead ofMVars: Rock uses a cache e.g. to keep track of what queries have already been executed. This cache is potentially accessed and updated from different threads. Before this change this state was stored in anMVar, but since it's only doing fairly simple updates, the atomic operations ofIORefare sufficient. - Being a bit more clever about the automatic parallelisation: We'll get back to this, but at this point in time Rock uses a Haxl-like automatic parallelisation scheme, running queries done in an
Applicativecontext in parallel. The change here is to only trigger parallel query execution if both sides of an application of the<*>operator do queries that are not already cached. Before this change even the cache lookup part of the queries was done in parallel, which is likely far too fine-grained to pay off.
We can clearly see in ThreadScope that the parallelisation has a seemingly good effect for part of the runtime, but not all of it:
Unfortunately I didn't update Sixty in between the two changes, so I don't really know how much each one contributes.
Optimisation 3: Manual query parallelisation
I wasn't quite happy with the automatic parallelism since it mostly resulted in sequential execution. To improve on that, I removed the automatic parallelism support from the Rock library, and started doing it manually instead.
Code wise this change is quite small. It's going from
to
where pooledForConcurrently_ is a variant of forM_ that runs in parallel, using pooling to keep the number of threads the same as the number of cores on the machine it's run on.
Here are the timings:
| Time | Delta | |
|---|---|---|
| Baseline | 1.30 s | |
| RTS flags | 1.08 s | -17 % |
| Rock | 0.613 s | -43 % |
| Manual parallelisation | 0.451 s | -26 % |
Being able to type check modules in parallel on a whim like this seems to be a great advantage of using a query-based architecture. The modules can be processed in any order, and any non-processed dependencies that are missing are processed and cached on an as-needed basis.
ThreadScope shows that the CPU core utilisation is improved, even though the timings aren't as much better as one might expect from the image:
The flamegraph is also interesting, because the proportion of time that goes to parsing has gone down to about 17 % without having made any changes to the parser, which can be seen in the top-right part of the image:

This might indicate that that part of the compiler parallelises well.
Optimisation 4: Parser lookahead
Here's an experiment that only helped a little. As we just saw, parsing still takes quite a large proportion of the total time spent, almost 17 %, so I wanted to make it faster.
The parser is written using parsing combinators, and the "inner loop" of e.g. the term parser is a choice between a bunch of different alternatives. Something like this:
term :: Parser Term
term =
  parenthesizedTerm    -- (t)
  <|> letExpression    -- let x = t in t
  <|> caseExpression   -- case t of branches
  <|> lambdaExpression -- \x. t
  <|> forallExpression -- forall x. t
  <|> var              -- x
These alternatives are tried in order, which means that to reach e.g. the forall case, the parser will try to parse the first token of each of the four preceding alternatives.
But note that the first character of each alternative rules out all other cases, save for (sometimes) the var case.
So the idea here is to rewrite the parser like this:
term :: Parser Term
term = do
  firstChar <- lookAhead anyChar
  case firstChar of
    '(' ->
      parenthesizedTerm

    'l' ->
      letExpression
      <|> var

    'c' ->
      caseExpression
      <|> var

    '\\' ->
      lambdaExpression

    'f' ->
      forallExpression
      <|> var

    _ ->
      var
Now we just have to look at the first character to rule out the first four alternatives when parsing a forall.
Here are the results:
| Time | Delta | |
|---|---|---|
| Baseline | 1.30 s | |
| RTS flags | 1.08 s | -17 % |
| Rock | 0.613 s | -43 % |
| Manual parallelisation | 0.451 s | -26 % |
| Parser lookahead | 0.442 s | -2 % |
Not great, but it's something.
Optimisation 5: Dependent hashmap
At this point, around 68 % of the time goes to operations on Data.Dependent.Map:

Note that this was 15 % when we started out, so it has become the bottleneck only because we've fixed several others.
Data.Dependent.Map implements a kind of dictionary data structure that allows the type of values to depend on the key, which is crucial for caching the result of queries, since each query may return a different type.
Data.Dependent.Map is implemented as a clone of Data.Map from the containers package, adding this key-value dependency, so it's a binary tree that uses comparisons on the key type when doing insertions and lookups.
In the flamegraph above we can also see that around 21 % of the time goes to comparing the Query type. The reason for this slowness is likely that queries often contain strings, because most are things like "get the type of [name]". Strings are slow to compare because you need to traverse at least part of the string for each comparison.
It would be a better idea to use a hash map, because then the string usually only has to be traversed once, to compute the hash, but the problem is that there is no dependent hash map library in Haskell. Until now that is. I implemented a dependent version of the standard Data.HashMap type from the unordered-containers as a thin wrapper around it. The results are as follows:
| Time | Delta | |
|---|---|---|
| Baseline | 1.30 s | |
| RTS flags | 1.08 s | -17 % |
| Rock | 0.613 s | -43 % |
| Manual parallelisation | 0.451 s | -26 % |
| Parser lookahead | 0.442 s | -2 % |
| Dependent hashmap | 0.257 s | -42 % |
Having a look at the flamegraph after this change, we can see that HashMap operations take about 20 % of the total run time which is a lot better than 68 % (though there's still room for improvement). We can also see that the main bottleneck is now the parser:

Optimisation 6: ReaderT-based Rock library
Here's one that I did by ear, since it wasn't obvious from the profiling.
I mentioned that the Rock library used to support automatic parallelisation, but that I switched to doing it manually. A remnant from that is that the Task type in Rock is implemented in a needlessly inefficient way. Task is a monad that allows fetching queries, and is used throughout most of the Sixty compiler.
Before this change, Task was implemented roughly as follows:
newtype Task query a = Task { unTask :: IO (Result query a) }

data Result query a where
  Done :: a -> Result query a
  Fetch :: query a -> (a -> Task query b) -> Result query b
So to make a Task that fetches a query q, you need to create an IO action that returns a Fetch q pure. When doing automatic parallelisation, this allows introspecting whether a Task wants to do a fetch, such that independent fetches can be identified and run in parallel.
But actually, since we no longer support automatic parallelisation, this type might as well be implemented like this:
newtype Task query a = Task { unTask :: ReaderT (Fetch query) IO a }

newtype Fetch query = Fetch (forall a. query a -> IO a)
The ReaderT-based implementation turns out to be a bit faster:
| Time | Delta | |
|---|---|---|
| Baseline | 1.30 s | |
| RTS flags | 1.08 s | -17 % |
| Rock | 0.613 s | -43 % |
| Manual parallelisation | 0.451 s | -26 % |
| Parser lookahead | 0.442 s | -2 % |
| Dependent hashmap | 0.257 s | -42 % |
ReaderT in Rock |
0.245 s | -5 % |
Optimisation 7: Separate lexer
Let's have a look at the flamegraph at this point in time: 
The parser now takes almost 30 % of the total run time. The parser is written using parser combinators that work directly on characters, so it's also doing tokenisation, or lexing, on the fly.
I've been wondering about the performance impact of this practice, since it's quite common in the Haskell world. So the change I made here is to write a faster lexer that's separate from the parser, and then make the parser work on the list of tokens that the lexer spits out.
This turns out to be a great idea:
| Time | Delta | |
|---|---|---|
| Baseline | 1.30 s | |
| RTS flags | 1.08 s | -17 % |
| Rock | 0.613 s | -43 % |
| Manual parallelisation | 0.451 s | -26 % |
| Parser lookahead | 0.442 s | -2 % |
| Dependent hashmap | 0.257 s | -42 % |
ReaderT in Rock |
0.245 s | -5 % |
| Separate lexer | 0.154 s | -37 % |
The "inner loop" of the parser that I tried optimising in the "Parser lookahead" step has now become a case expression on the next token, visible here. Essentially, it's gone from matching on characters to this:
term :: Parser Term
term = do
  token <- getNextToken
  case token of
    Lexer.LeftParen -> parenthesizedTerm
    Lexer.Let -> letExpression
    Lexer.Identifier ident -> pure (Var ident)
    Lexer.Case -> caseExpression
    Lexer.Lambda -> lambdaExpression
    Lexer.Forall -> forallExpression
    Lexer.Number int -> pure (Lit int)
Optimisation 8: Faster hashing
The flamegraph at this point contains mostly things I don't really know what to do with, but there's one thing left, and that's hashing of queries, which now takes just short of 18 % of the total runtime: 
The change I made here is to write some Hashable instances by hand instead of deriving them, and to add couple of inlining pragmas. This gives a 5 % speedup:
| Time | Delta | |
|---|---|---|
| Baseline | 1.30 s | |
| RTS flags | 1.08 s | -17 % |
| Rock | 0.613 s | -43 % |
| Manual parallelisation | 0.451 s | -26 % |
| Parser lookahead | 0.442 s | -2 % |
| Dependent hashmap | 0.257 s | -42 % |
ReaderT in Rock |
0.245 s | -5 % |
| Separate lexer | 0.154 s | -37 % |
| Faster hashing | 0.146 s | -5 % |
The new flamegraph shows that query hashing is now down to around 11 % of the time. 
Conclusion
I was able to make the Sixty compiler nine times faster for this benchmark by using the excellent profiling tools that we have for Haskell. There's no reason to be optimising in the dark here.
As a reminder, here's what the compiler looked like in ThreadScope to start with:
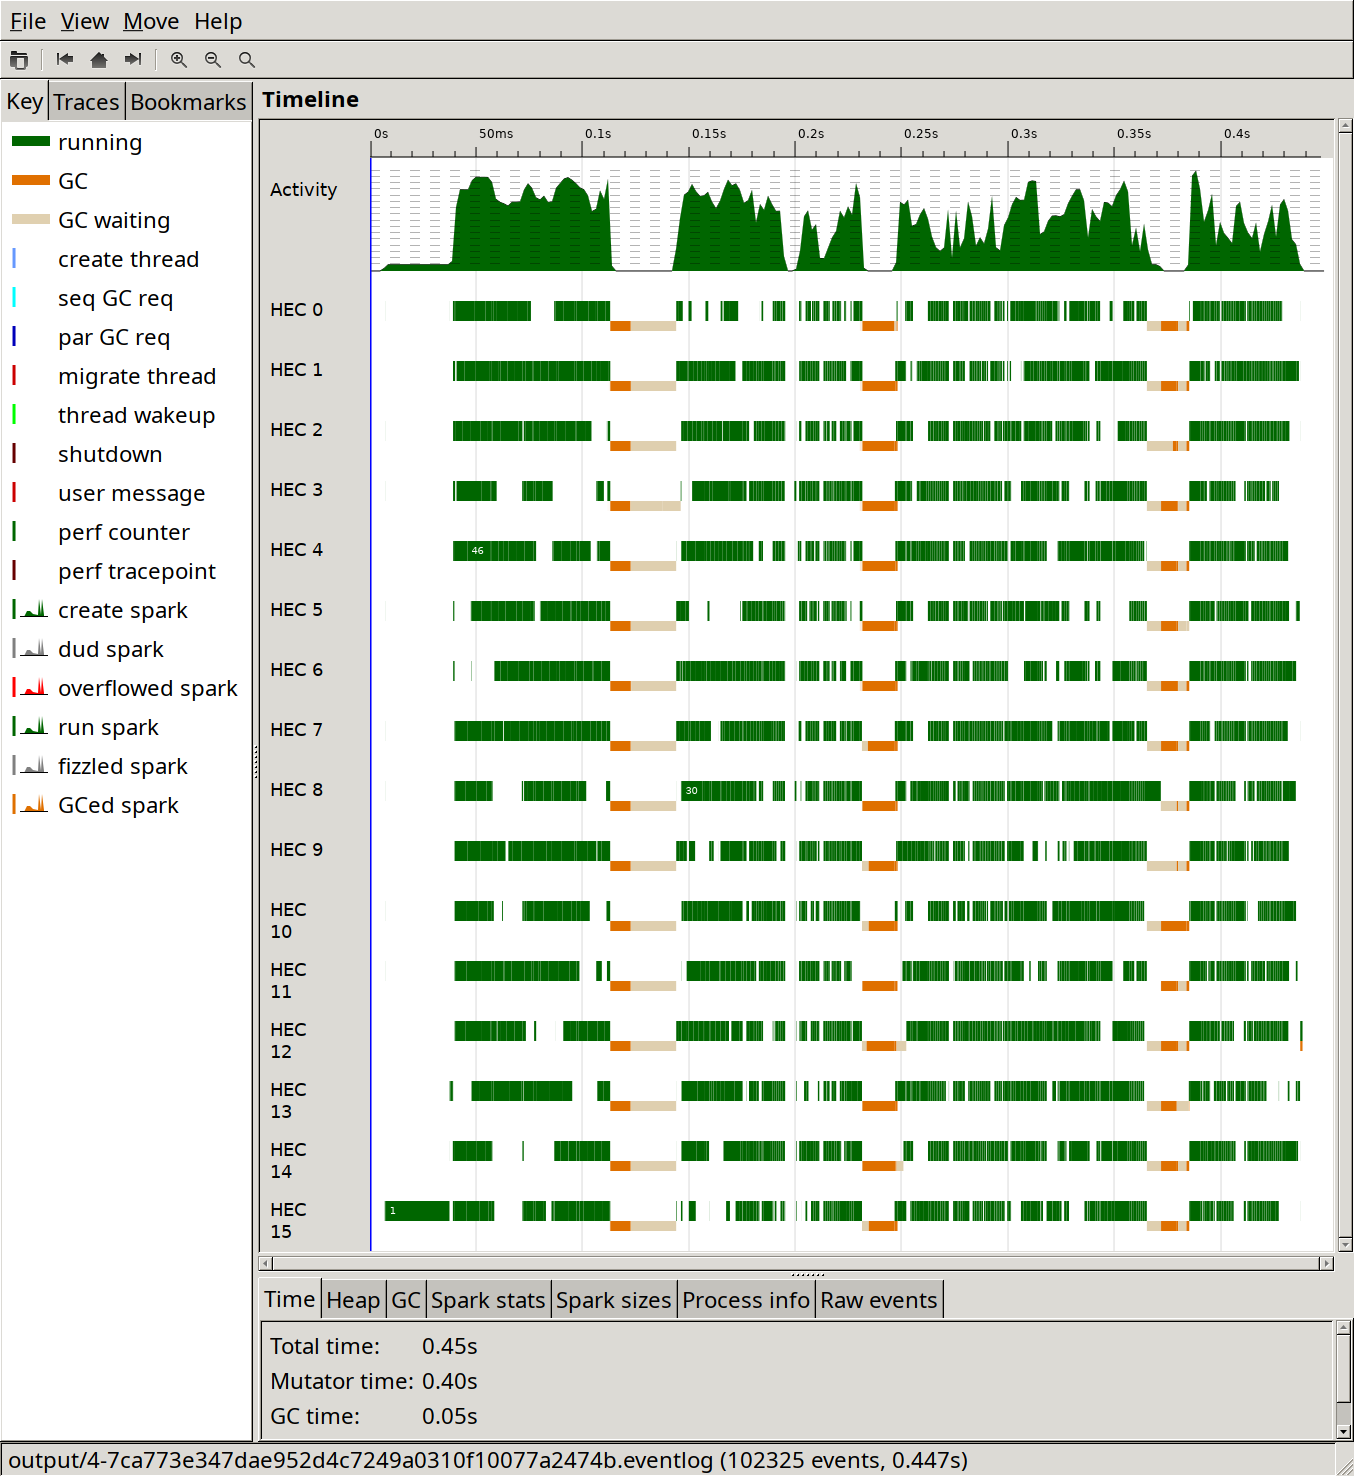
Here's where we're at now:

It looks faster and it is faster.